Process Mapping is a fundamental component of all process improvement methodologies whether it is Six Sigma, Lean, TQM, ISO 9000, BPM, or any other discipline introduced in the past several decades. In order to make process improvements, it is beneficial to clearly visualize and understand the process at various levels and at various points of time from the current state to the target state.
What is a process map?
A process map is a visual tool to help document the process and includes all inputs and outputs. Process maps can be at a high level or at a more detailed level depending on the desired use and stage of a process improvement project.
Example of two types of process maps (others exist):
- Cross functional map (Swimlane) – shows the relationship between the process and the departments performing steps in the process
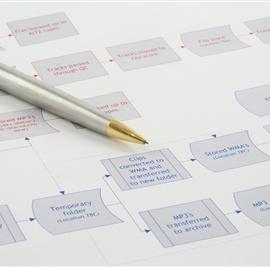
- Basic Flowchart – typically shows a series of process steps for a single output


Why is process mapping important?
- Process mapping allows you to visually define the scope and boundaries of your improvement project by identifying and documenting the start and end of the process.
- Process mapping allows you to identify all the process inputs and outputs and relate them to a specific process step.
- Participating in a process mapping exercise allows teams to thoroughly understand and agree on the work that they do and collectively identify areas for improvement.
- A detailed process map can be used as a training tool for new employees to an organization.
How to get started with creating a process map:
- Select process mapping software. Many tools are available for free and in the market from major software vendors.
- Determine the “starting” point and then walk and document each process step until you get to the point you have identified as the “end” of the process. This sets the boundaries.
- If you are knowledgeable of the process yourself, you can begin on own your own, however, it is typically advantageous to gather a few process experts in this exercise.
- Use symbols to depict the flow of actions and decisions in the process.
- List all the inputs and outputs to each process step.
- Gather data at all process inputs and outputs. Depending on your use of the process map, you can identify the time, value, and cost of each process step.
Branner Consulting, LLC can help you at any stage along your journey from process documentation to implementing process improvement projects. We also provide coaching and training in Six Sigma and Lean methodologies.

Comments are closed.